Research: OTT devices driving connected market
June 14, 2018
Research by Ampere Analysis reveals that online households now own an average of 4.5 different types of connected devices. The research also shows that they’re every bit as attached to the technology brands that manufacture their hardware as they are to the online services this hardware enables them to access.
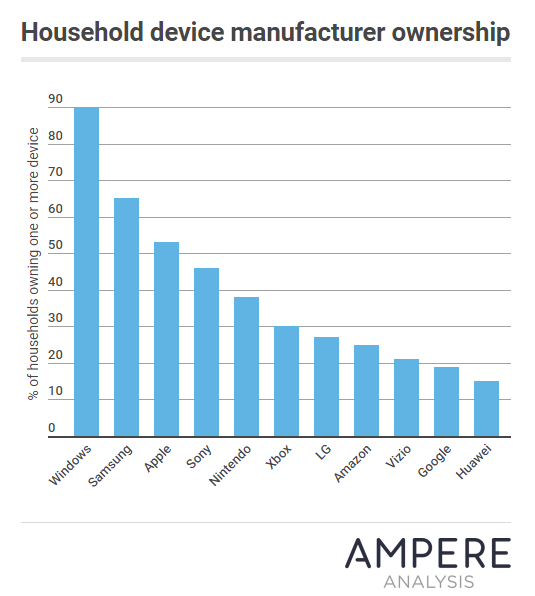 The survey of 22,000 respondents in 10 markets gives a clear picture of digital ownership and reveals the habits and preferences of today’s connected consumers. According to the survey, Windows devices dominate homes at present. 90 per cent of online homes own at least one Windows based device, typically a laptop or a desktop. Samsung comes in at second place; almost two thirds of respondents globally (65 per cent) own one or more Samsung device. But whereas the majority of Windows devices are personal computers, Samsung device usage spans a mix of smartphones, tablets and Smart TVs. Apple is at third place, present in 53 per cent of online households.
Commenting on the research, Richard Broughton, Research Director at Ampere Analysis said: “Windows devices may be the dominant device in 2018, but with ownership primarily confined to laptops and desktops, sales of both of which are in decline, there is real question mark over how long Windows will continue to wear that crown. With two thirds of households owning a Samsung device, it’s a serious contender for the top spot in the future.”
Saturation point for laptops as device substitution grows
According to the research, many devices are now reaching saturation point, particularly laptops, smartphones and tablets. Uptake for laptops has peaked as they are substituted with smartphones and tablets across all age brackets. And while older users were slower to embrace the smartphone, the uptake rate has closed significantly: 97 per cent of millennials now own a smartphone, as do more than 90 per cent of other age groups. Apple and Samsung dominate the smartphone sector with 50 per cent of share between them, while a plethora of other brands including Huawei, LG and Sony stake a significant claim on the remaining market.
The battle for hearts and minds: Apple vs Samsung
While Samsung is the second biggest brand after Windows in terms of device ownership, the research suggests that it may be Apple who is winning the battle for hearts and minds. Although they both boast brand loyalty, Apple device owners are more likely to have other Apple devices than Samsung owners are to own other Samsung devices. 61 per cent of US internet users own one or more Apple devices, and two thirds of those own multiple Apple products.
“In a market of increasing saturation and standardisation, brand loyalty counts more than ever,” said Sarah Fisher, Analyst at Ampere Analysis. “In this respect, Apple is a clear winner, especially with its skew towards younger, more affluent consumers. But while Apple has a clear and loyal following amongst its enthusiasts, the research shows that it has some way to go to close the gap with Samsung in terms of sheer market reach. As Smart TVs are still a high growth area, a market from which Apple is absent and Samsung is a dominant player, Samsung is the one to watch.”
Sticks and boxes break the mould
 Against a backdrop of saturation, OTT boxes are driving device growth in 2018 and beyond. Boxes and sticks are one of the fastest growing categories of connected device, driven in part by older consumers who have begun to adopt OTT boxes. Within the last two years, ownership of boxes and sticks has doubled amongst those aged over 44. Google’s Chromecast remains the market leader, favoured by one in three consumers globally. But Amazon’s Fire TV Stick has made a big impression on the European market, most notably in the UK and Germany where it is the number one streaming box/stick. It is also closing in on Roku’s market leader position in the US.
Good content drives device purchase
The research reveals a symbiotic relationship between the availability of high quality media content and Smart TV purchases. For every 10 per cent of homes that have an SVoD subscription, about 6 per cent of homes will buy a Smart TV within a two-year period.
Effectively, this means that for every additional $1 that is generated by Netflix in subscription revenue from new customers in their first year, $1.20 is made by TV manufacturers selling Smart TVs to them. This demonstrates that content is key for device manufacturers, and likely to become a bigger driving force behind consumers’ technology choices in the future.