Research: Average consumer uses 11+ video services
March 2, 2023

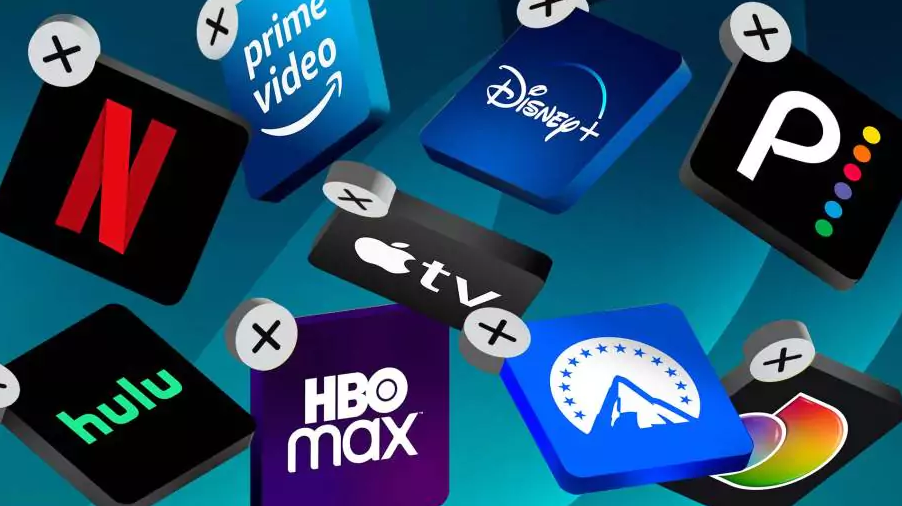
Research from entertainment technology specialist TiVo finds that the average number of video services used by consumers has surpassed double-digits for the first time since TiVo started tracking this metric in the Video Trends Report in 2012, up to an average of 11.6 video services from 8.9 a year ago and 9.9 in Q2 2022.
According to the report, this growth is occurring despite subscription video on demand (SVoD) usage dropping; 26.6 per cent of respondents dropped an SVoD service over the last 6 months, an increase of over 8.0 per cent year over year. The video services growth is soaring due to an increasing usage of ad-supported video on demand (AVoD) and free ad-supported streaming TV (FAST).
The current economic climate and concerns over inflation are impacting consumer spend, forcing people to reconsider the number of services they pay for each month and opt-in to free and ad-supported choices. According to the report, adoption of totally free video services, including AVoD and FAST, has grown by almost 70.0 per cent year over year – reflecting that these services continue to capture a greater share of the market. 64.0 per cent of consumers now utilise at least one AVoD or FAST service, driven largely by millennial audiences, up from 60.0 per cent year over year. The number of choices continues to benefit consumers, but it has led to content discovery becoming even more complex and varied. People still mostly rely on commercials and word of mouth to inform them of other TV shows and movies they’d like.
“We’re at an inflection point in the digital entertainment industry as consumers seek to take advantage of the flood of content choices and service types available but now wrestle with the paradox of choice,” said Scott Maddux, VP of global content strategy and business at Xperi. “Discovery shouldn’t be a chore, and it is imperative that entertainment platforms and video technology providers prioritise simplicity for consumers in order to make discovery and viewing experiences as enjoyable as possible.”
Additional report highlights:
- Bingeworthy content: More than half of respondents (53.0 per cent) prefer when the whole season of a TV show is available at once, compared to only 24.7 per cent who prefer episodes to be released one per week. During Q4 there was a strong difference among men and women in consuming content, with women reporting a strong preference for the opportunity to binge a whole season (61.0 per cent), whereas men report a stronger preference for the weekly release schedule (60.0 per cent).
- Generation gap: When examining the increase of video services, there are some glaring differences among service consumption when it comes to age groups. Millennial respondents consumed significantly more than any other age group with an average of 16.3 sources compared to Gen Z with 12.7 sources and Gen X with 12.2 sources.
- Eye on spending: In recent months, respondents appear to be evaluating and adjusting their entertainment spending more often, with around 18.0 per cent saying they currently do so every month or more compared to only 13.0 per cent a year ago.
- Entertainment at home: While the recent pattern of economic inflation has caused 30.0 per cent of respondents to reduce their overall entertainment spending, almost three-quarters of respondents (74.0 per cent) say they’re slightly or much more likely to look for entertainment at home than going out. To support this at-home entertainment, these respondents are investing in their home set-up with one-third purchasing a new TV in the last six months.
The full report is available here.
